Our 2H23 market outlook has brightened modestly following the most recent inflation report, which lowered our recession assessment. However, inflation will need to continue to ease into the autumn months in order to provide an all clear on the inflationary coast.
While recession risk has ebbed, the economy continues to straddle a knife’s edge. If growth accelerates too fast rates will stay higher for longer, raising the probability of a hard landing. Rising corporate bankruptcies show that higher rates are indeed starting to have an impact on the corporate sector that has highs debt levels. The consumer is relatively healthy, but higher rates are slowing housing and auto activity as well. On a first-principals analysis, you can’t dismiss the slowing effects of higher rates on an economy that has near-historically high debt load. We do not believe that mega-cap tech share prices provide a signal on the broader economy.
We have modestly increased risk allocation, but we continue to see a higher probability of a recession than a soft land. Our value-oriented process sees better risk-reward away from mega-cap tech.
Dispatch #7 of 2023 completed on July 21st evaluates the following subjects
- Inflation path hard to predict
- The resilient consumer
- Rising corporate bankruptcies
- Sentiment/positioning data to fit both narratives
- Valuation expansion drives gains
2H23 market outlook
Predicting the 2H23 market outlook remains a challenge as data is mixed.
Inflation path hard to predict
Incoming inflation data has certainly improved. Chairman Powell’s preferred “super-core” CPI has slowed sharply.
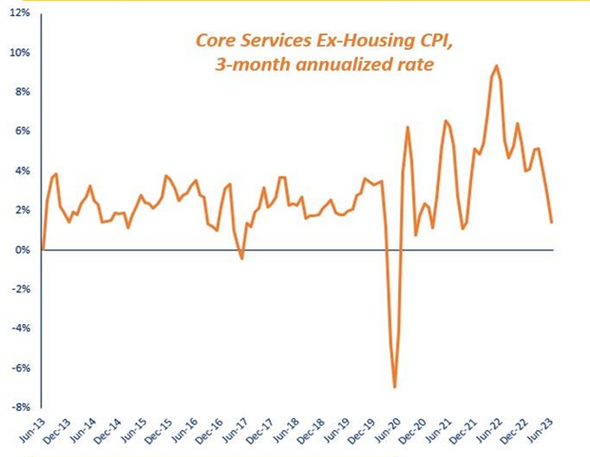
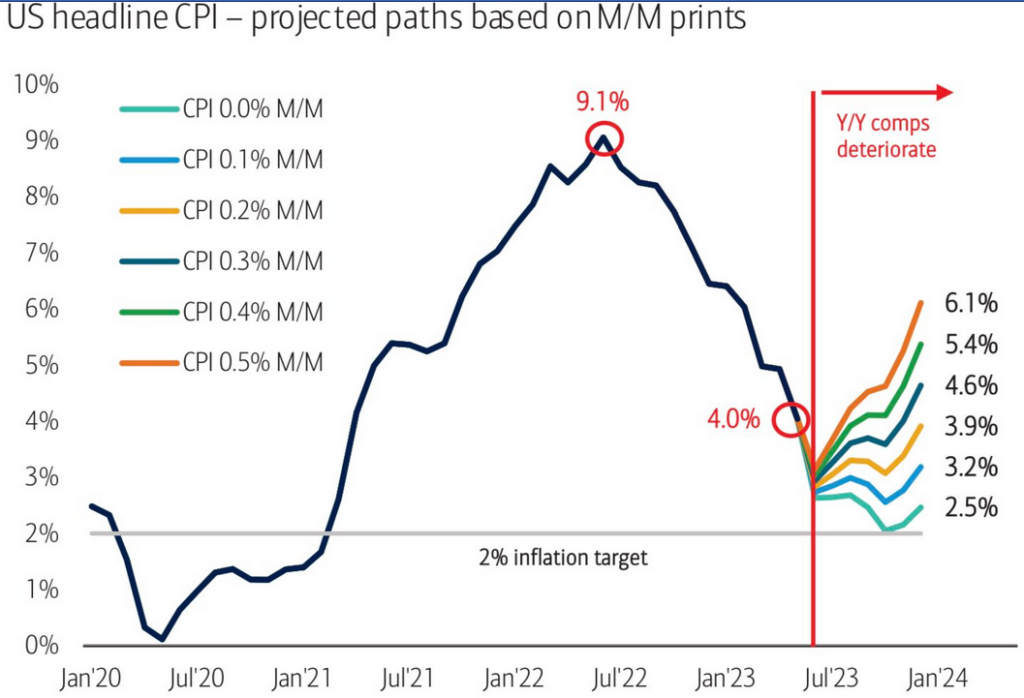
However, some of the favorable trends are due to easy year-earlier comparisons. The table illustrates the potential headwinds in the coming months as base effects become less favorable.
Source: BofA
If headline CPI continues to increase at the 0.2% MoM rise reported in June, we will see YoY rates start to climb in the coming months, which is likely to push the Fed to maintain higher rates for longer.
Furthermore, expectations of inflation cooling hinges on falling shelter prices, which hinge on correlation with rent indices like Zillow’s that have fallen sharply. For interest rate policy setting, the Fed focuses primarily on core CPI, which has a 40% shelter weight.
Zillow Rent Index (YoY change)
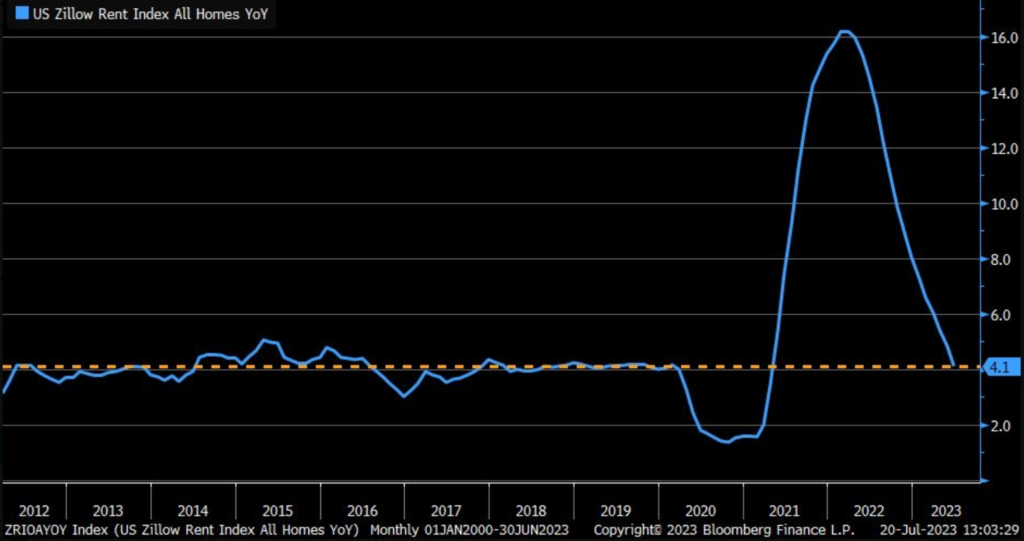
Source: Liz Ann Sonder
However, home prices have barely declined and have started to tick back higher. Even if shelter inflation cools in the coming months, reaccelerating homes prices are a worrying trend.
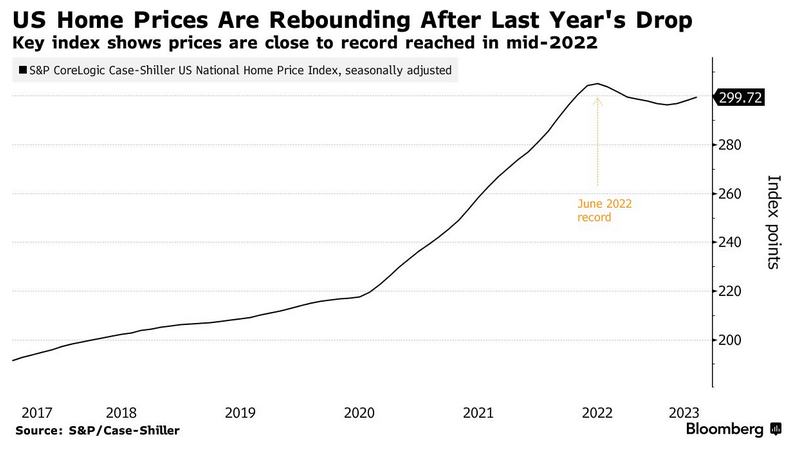
Source: Bloomberg
This set up is too much of a toss up for us to make a strong bet. The shelter component correlated to both rent indices and house prices, and we aren’t sure how CPI will evolve. In addition to shelter, a burst of energy or agricultural product-price spike could easily uncork the inflation genie. This uncertainty should be clarified by the end of this year.
The consumer is nominally resilient
Thankfully, consumers are relatively under leveraged and the bulk of the debt pegged to low fixed-rate mortgages. US real estate firm Redfin estimates that 92% of households have locked in rates below 6% and 82% are below 5%.
US Consumer Debt to GDP
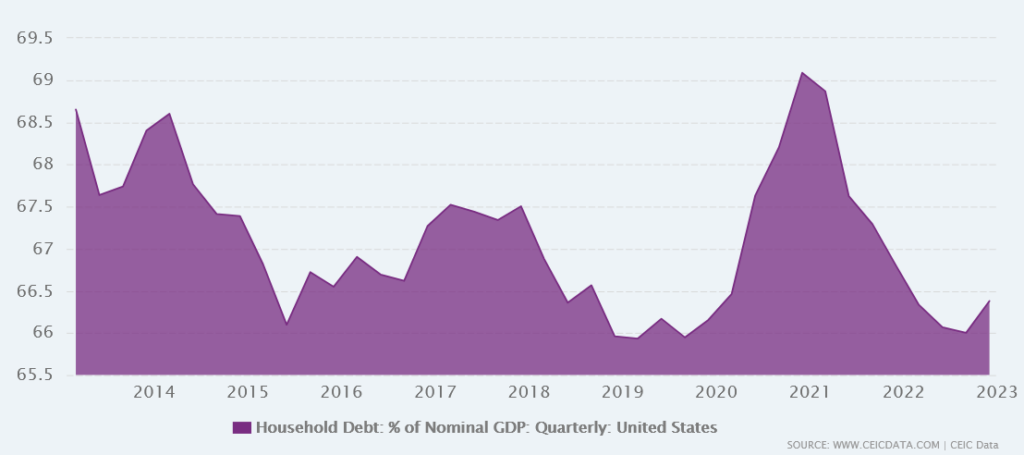
Source: CEIC
Nominal retail sales have been strong, but these should ease alongside inflation.
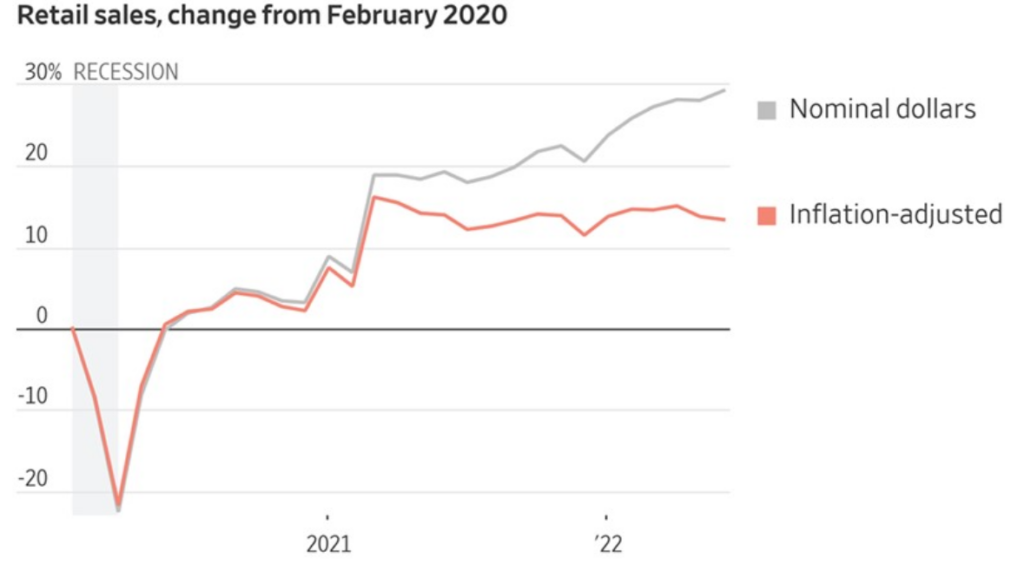
Source: WSJ via Mohamad El-Erian
Underlying data that matters for companies has been slowing. Some of the store weakness is likely the switch to online shopping.
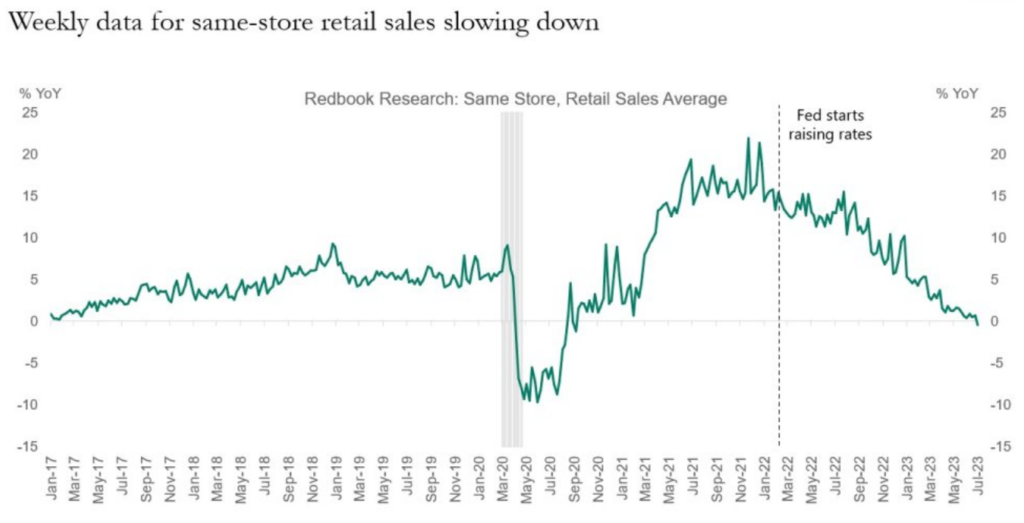
Source: Apollo Global
In the short-term, markets trade on performance relative to expectations. Then, expectations rise even as the slowing trend continues, leading to disappointment down the road. We are likely heading down this path in the back half of the year.
Is the US consumer less rate-sensitive today?
We hear this assertion to explain relatively robust economic data. We aren’t sold on this thesis. The ratio of mortgage debt (fixed rate) to consumer credit (floating rate) outstanding shows a reversion towards the long-term trend. The conclusion based on this one metric is that the consumer today has less mortgage debt relative to consumer loans. This makes it unlikely that the economy is less interest rate sensitive.
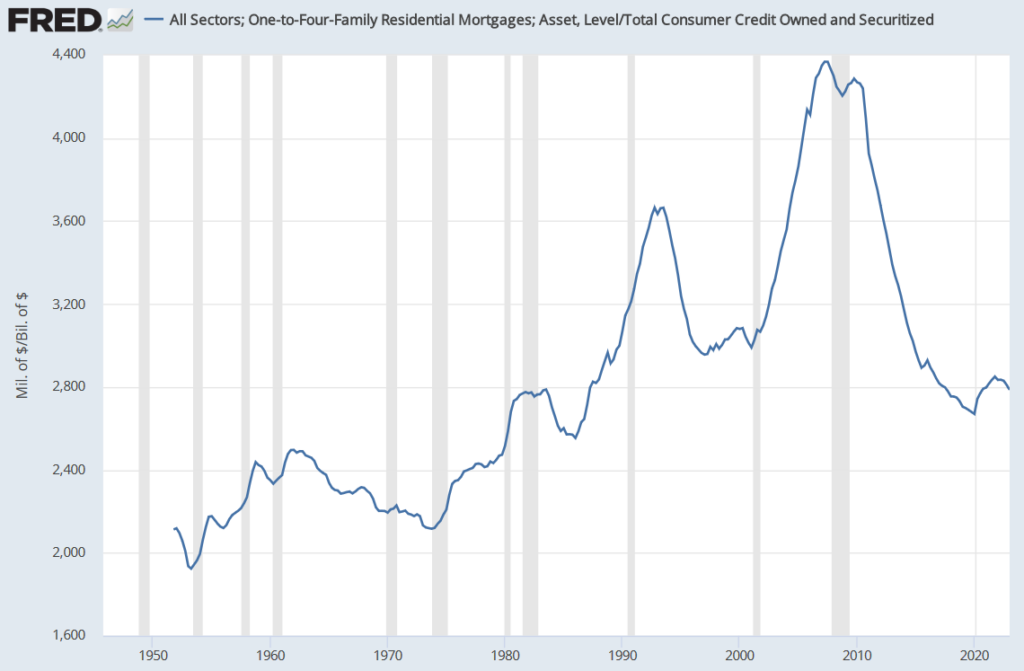
Source: St Louis Fed
Note: The mortgage data is in $s million & the consumer credit data in $s billion.
Only credit card debt, which is currently a relatively small ~$1tn outstanding, is truly floating rate as existing auto and student loans are fixed rate. New debt issuance is exposed to higher rates, and there we have evidence of slowing.
The sharply lower existing home sales is evidence of higher rates slowing activity, even as the media is more focused on robust home prices.
US existing home sales (,000)
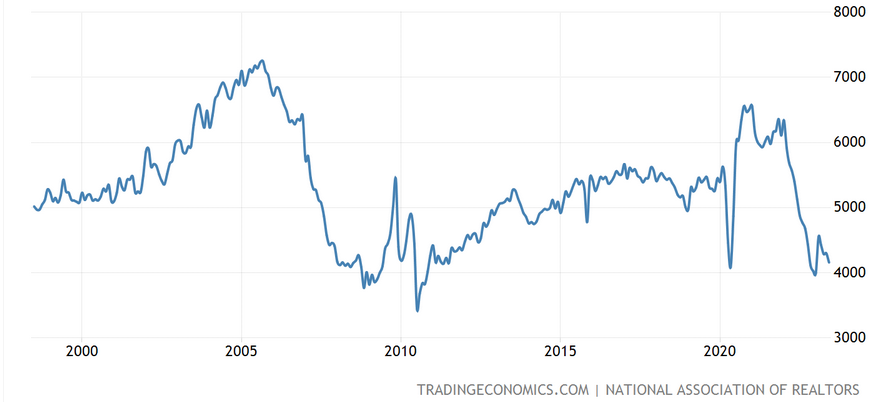
Source: Tradingeconomics
Note: The Y axis is seasonally adjusted annual run rate in thousands. 4000 = 4m annualized sales
Auto loan rejection rates hit an all-time high in June 2023. Tighter lending standards and incomes not keeping pace with rising monthly payment are likely behind the trend.
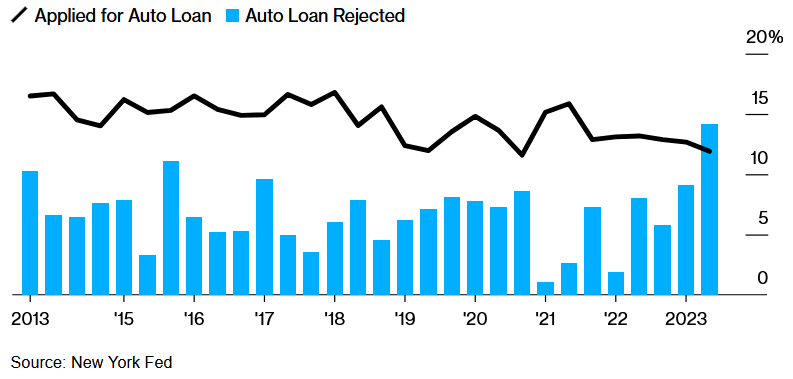
Source: Bloomberg
As prior Dispatches have repeatedly highlighted, credit contraction is one of the best leading recession indicators. We do not believe this time will be different.
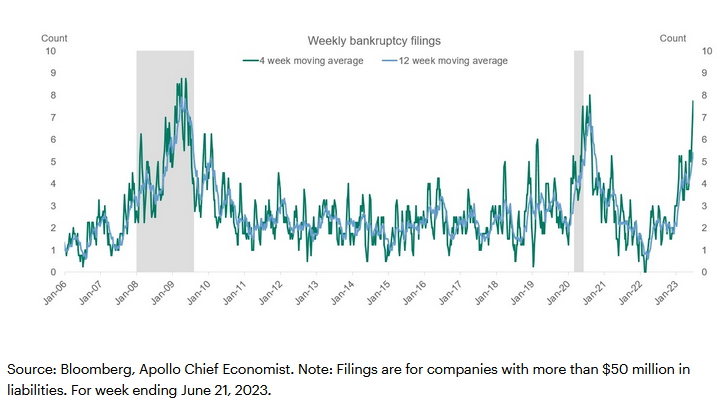
Rising corporate bankruptcies warrant caution
The pressure from higher rates is most notable in the corporate sector, where we are seeing a notable rise in defaults.
Unsurprisingly, companies with floating rate leveraged loan debt exposure are seeing rising failures. Note that “LTM” in the chart below is the last twelve months.
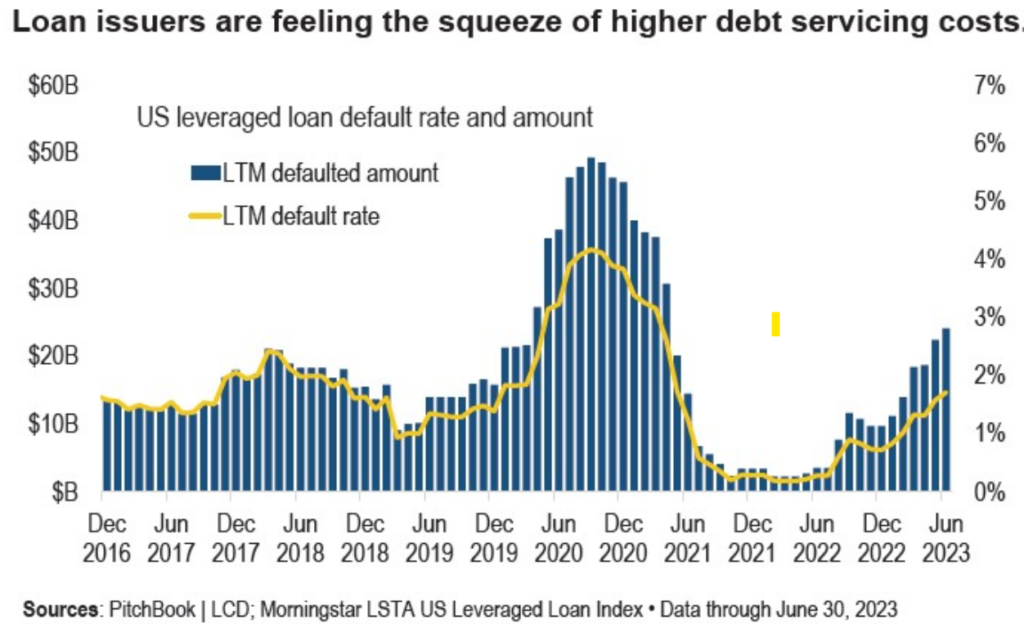
Source: LCD News
The chart below shows how fixed-rate non-investment grade, aka “junk”, bond yields have also doubled since the rate-lows of 2021. The refinancing needs will spike from 2025, which Dispatch #5 analyzed in more detail.
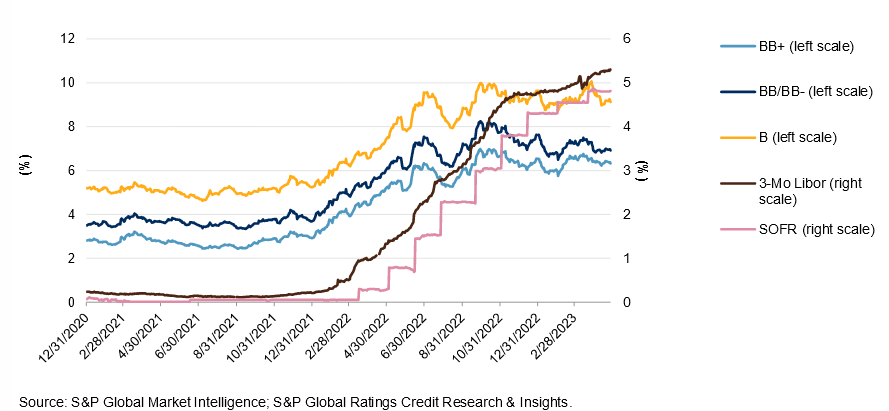
Source: S&P Global
Positioning provides data to support many view points
Bulls point to the BofA fund manager survey below to claims that investors are underweight stocks.
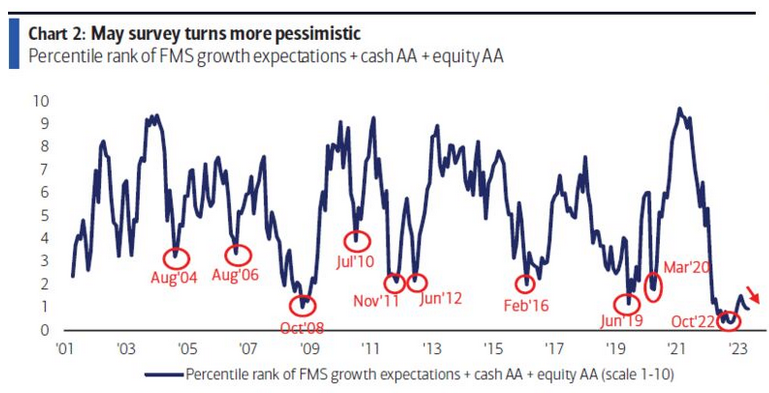
Source: BofA via Bloomberg
That same survey also shows a record bond overweight.
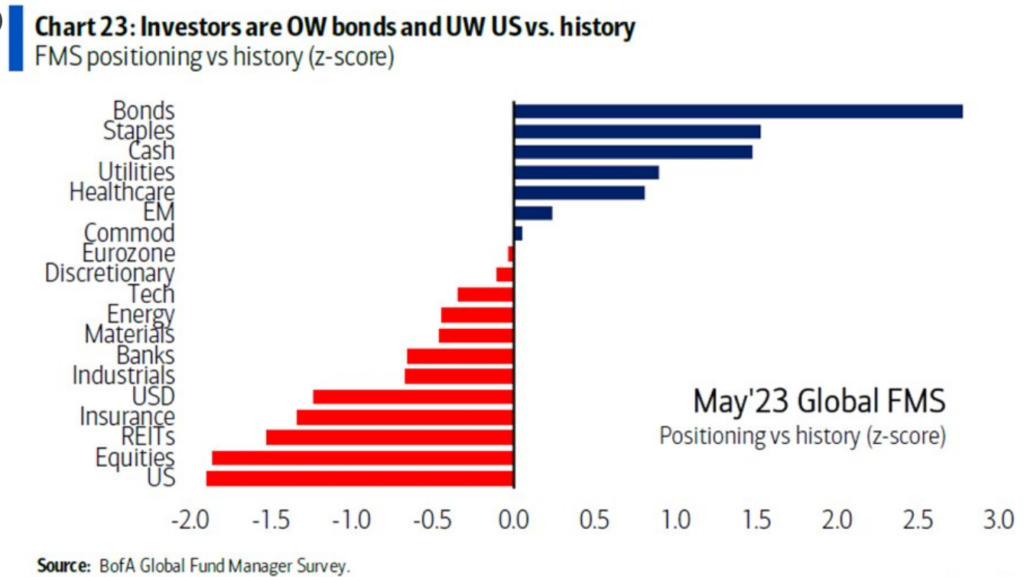
Source: BofA via Ryan Detrick
However, record shorts in bond futures do not add up. How can institutional investors be overweight bonds but also record-short bonds? Bloomberg says leveraged basis trade is behind this extreme futures position. Either way, survey data is not always infallible.
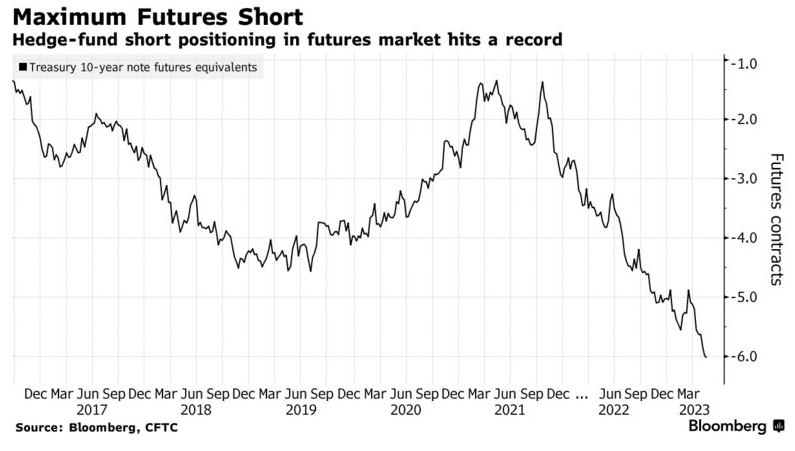
Source: Bloomberg
Retail positioning surveys point to a sharp increase in equity allocations.
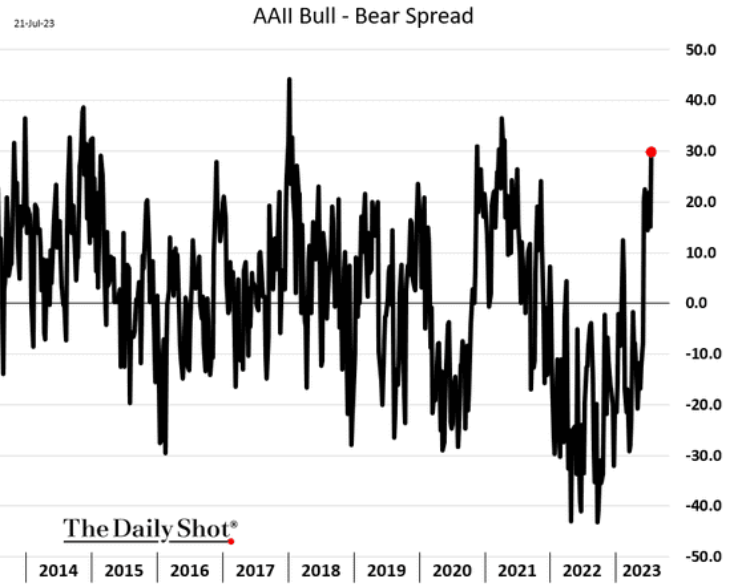
Source: The Daily Shot
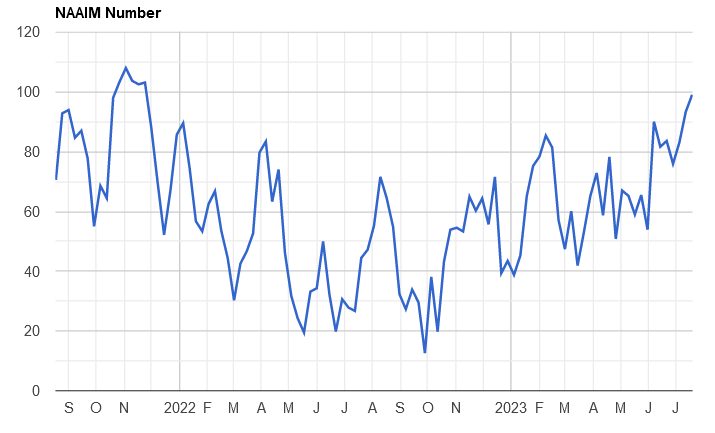
The market exposure survey by National Association of Active Investment Managers (NAAIM), aka wealth managers like RockDen, shows a rapid increase in equity exposure since the October lows. We do question the veracity of the survey as many wealth managers allocate clients into a static portfolio that don’t change frequently. The chart below makes the advisor-managed portfolios appear like a quant fund momentum strategy!
NAAIM Exposure Index
Source: NAAIM
Quantative strategies that increase risk exposure as stock volatility falls have participated in this rally. With the VIX index (expectations of S&P 500 volatility) pushing 12-month lows, these funds have increased equity exposure. These funds will be sellers if the VIX rises.
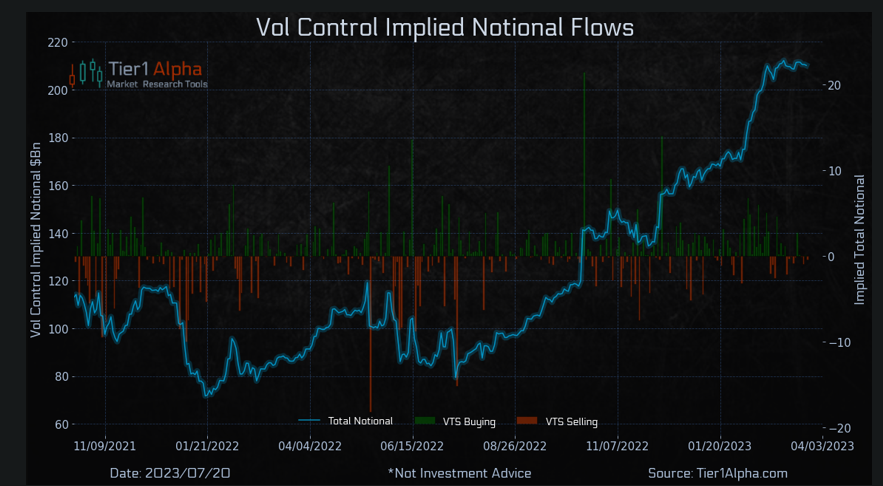
Source: Tier1Alpha
We’ll be watching the VIX seasonality.
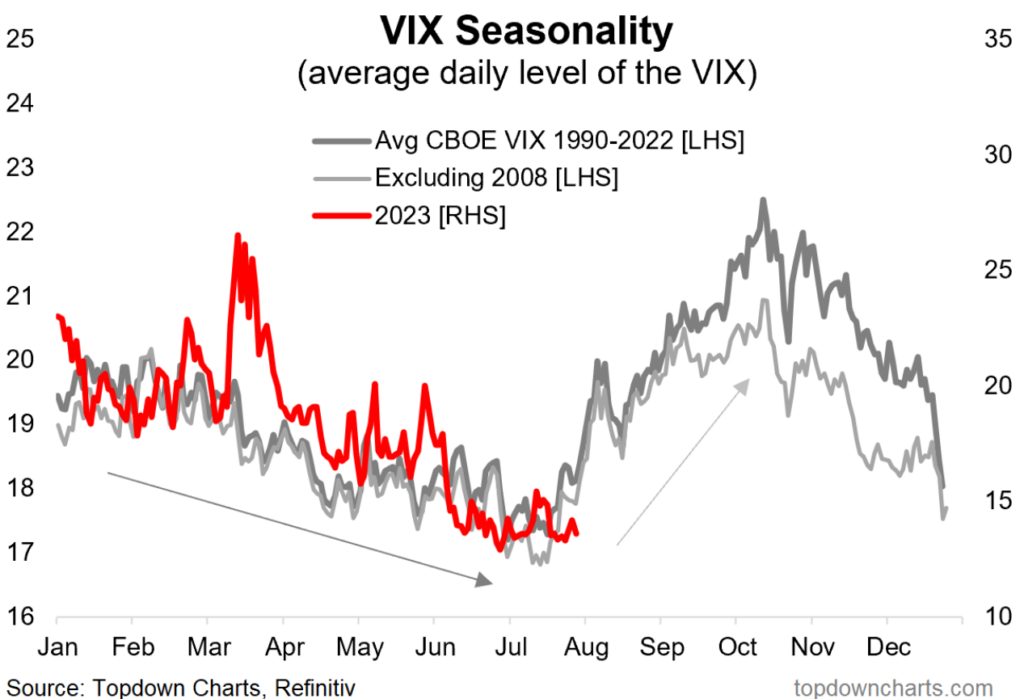
Source: Topdown charts
Valuation multiple expansion has driven gains
The valuation increase is most obvious within the megacap tech group.
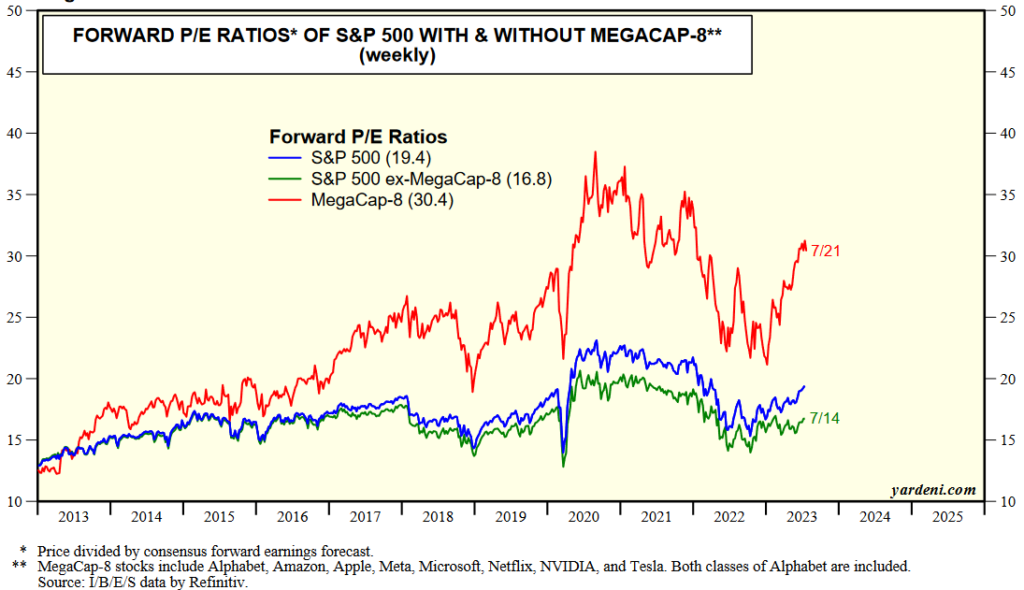
Source: Yardeni Research
Large cap S&P 500 stocks outside megacap tech remain reasonably valued. The chart below provides a different spin on the same theme.
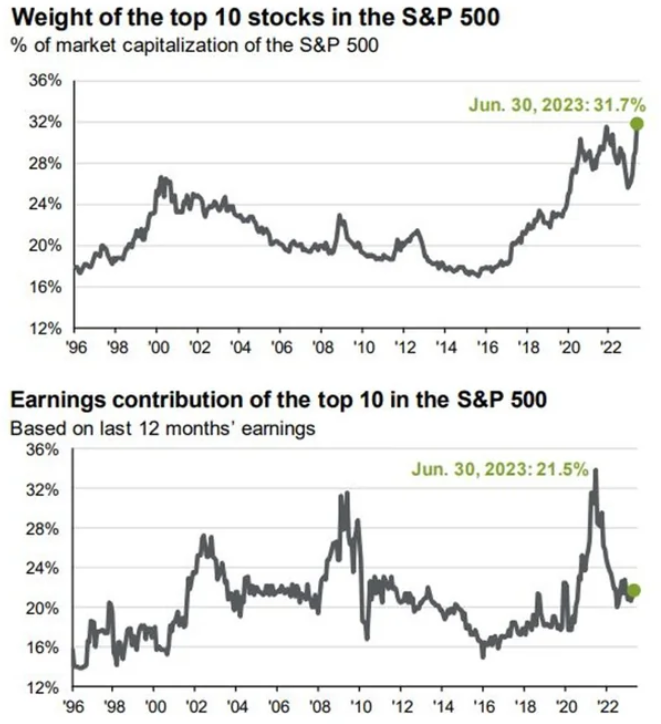
Source: JPMorgan Asset management
Nor is AI excitement leading to a broader tech rally based on lowered guidance from TSMC, the world’s largest chip manufacturer, and weak Taiwanese exports. Yes, the demand for AI chips is growing but it’s too small to offset the slowing overall chip demand, in our view.

Overall, the rally has broadened since June, which is encouraging. The S&P 500 outside the megacaps is reasonably valued, and this is our preferred exposure.
However, our base case remains that the US economy does enter a recession in late 2023 or early 2024. On a first principals basis, rapidly rising rates into historically high indebtedness (government and corporate) are likely to slow activity. There are many signs of slowing, and growth accelerating will only redouble Fed efforts to squash inflation by keeping rates higher. This outcome risks a deeper contraction, which tempers our outlook for risk assets even as we have raised exposure.
With this cautious view in place, we will stay vigilant with incoming data and aim to reduce risk exposure if labor market, bankruptcies and other leading indicators deteriorate further.
Important Disclosures
| This is not an offer or solicitation for the purchase or sale of any security or asset. Nothing in this post should be considered investment advice. While the information presented herein is believed to be reliable, no representation or warranty is made concerning its accuracy. The views expressed are those of RockDen Advisors LLC and are subject to change at any time based on market and other conditions. Past performance may not be indicative of future results. At the time of publication, RockDen and/or its affiliates may hold positions in the instruments mentioned in this newsletter and may stand to realize gains in the event that the prices of the instruments change in the direction of RockDen’s positions. The newsletter expresses the opinions of RockDen. Unless otherwise indicated, RockDen has no business relationship with any instrument mentioned in the newsletter. Following publication, RockDen may transact in any instrument, and may be long, short or neutral at any time. RockDen has obtained all information contained herein from sources believed to be accurate and reliable. RockDen makes no representation, express or implied, as to the accuracy, timeliness or completeness of any such information or with regard to the results to be obtained from its use. All expressions of opinion are subject to change without notice, and RockDen does not undertake to update or supplement its newsletter or any of the information contained therein. |