At first blush, it certainly looks like the bank failures may have driven the bitcoin rally higher. Bitcoin and the crypto sector overall had already experienced a crushing drawdown, and the bank failures highlight the fragility of our current debt-laden economic system. However, a deeper look shows that higher beta tech stocks have done just as well since the banking stress and the rally lacks both volume and breadth. We continue to be bullish on bitcoin and select other crypto tokens over the long term. Over the near term, with a cautious view on liquidity, we have limited enthusiasm for the current rally.
Dispatch #4 of 2023 completed on April 14th evaluates the following subjects
- Bank failures and the bitcoin rally
- What caught our eye this week
Bank failures and the bitcoin rally
Bitcoin has rallied over 50% since bank failures peaked in early March and the Fed announced the BTFP program to provide liquidity to banks. Loans made to banks by the BTFP program mechanically increase the Fed balance sheet, and there has been vigorous debate about whether the Fed has restarted quantitative easing. As we argued in Dispatch 3 we do not believe Fed QE has not restarted.
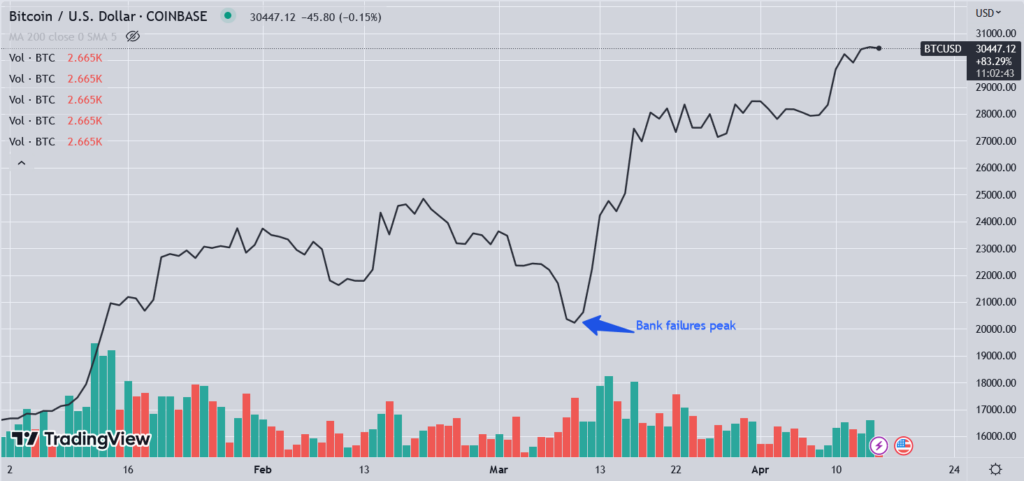
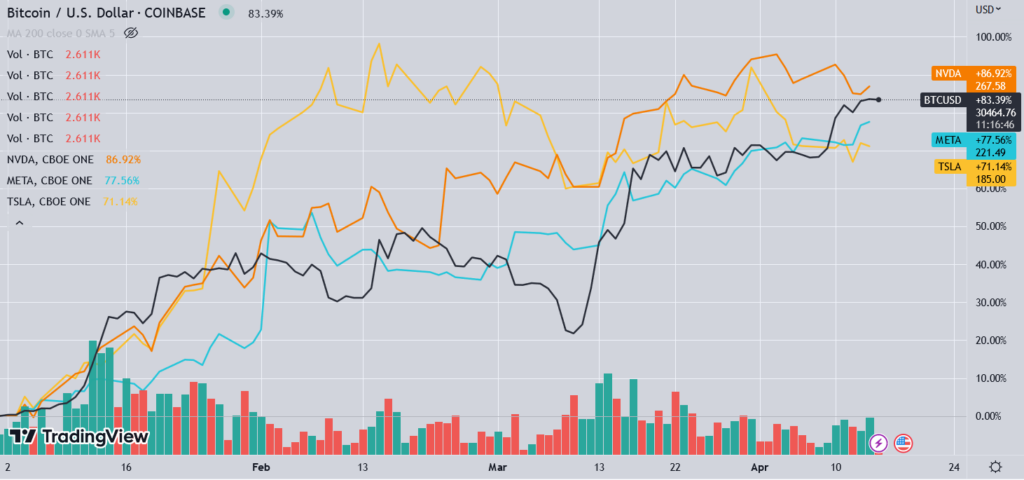
Source: TradingView
Crypto absorbed multiple shocks in 2022, and the negative impacts peaked in June with the 3 Arrows Capital fund collapse. The fraud and implosion of FTX, which was the biggest crypto media event, did not have as large of a liquidation impact. By then, much of the excess had been whittled away. The chart below from this Chainalysis blog post shows investors losses in 2022.
Realized profit of crypto transacted each week
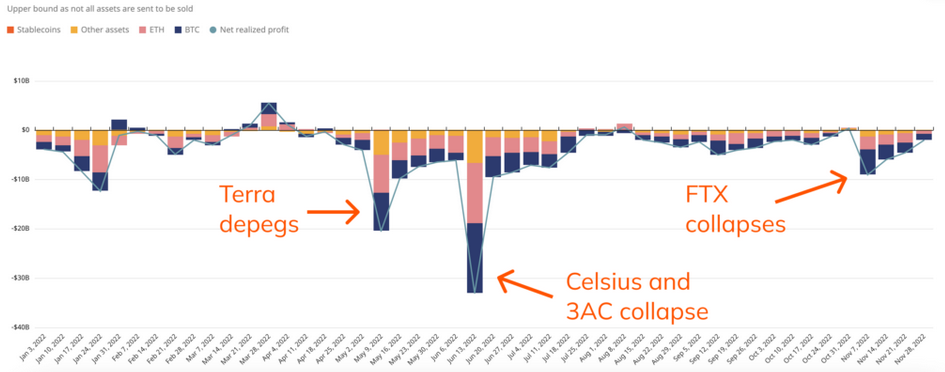
Source: Chainalysis
The chart shows that the weekly losses in June following the Terra collapse ($20.5bn) and subsequent failure of crypto hedge fund 3AC ($33.0bn) was far greater. Yes, FTX has caught greater public attention because of the brazen fraud (makes for great reading), but the market impact was a loss of $9.0bn.
Bitcoin had already reached levels seen in previous bear market lows
One of the simplest is the ratio between the market cap of bitcoin and the realized value. Realized value here is the value of all the tokens based on when each token was last moved (assumed to be the purchase price) on the blockchain.
MVRV Z-score remain in undervalued
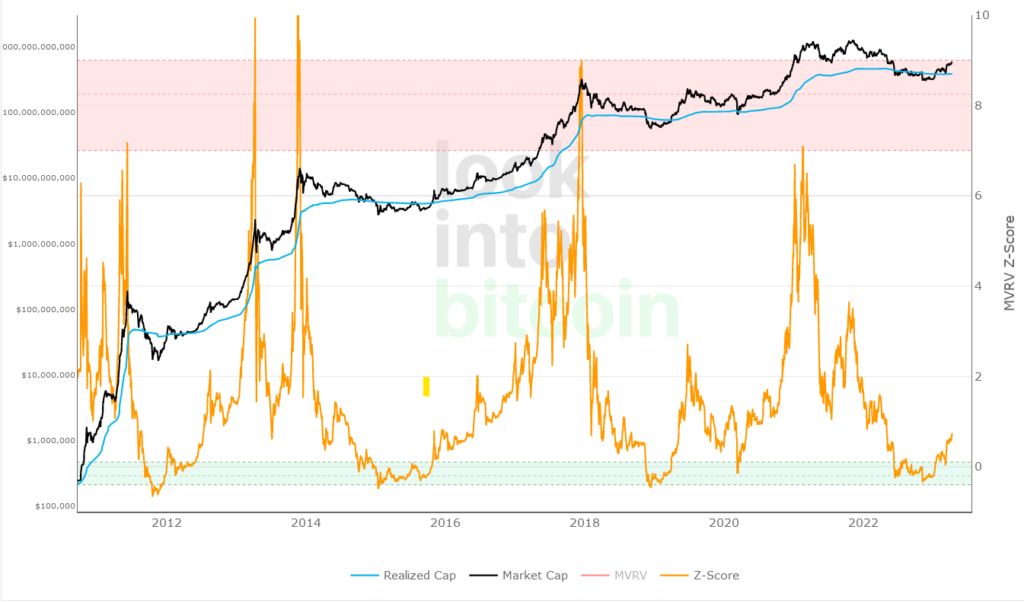
Source: Look into Bitcoin
The realized HODL ratio chart below tracks the ratio between bitcoin that were last moved less than 1 week ago and those that we move between 1-2 years ago. The idea here is that at market peaks, investors with longer holding period and high profits exit, which then moves prices lower. An explanation of the RHODL ratio is available here.
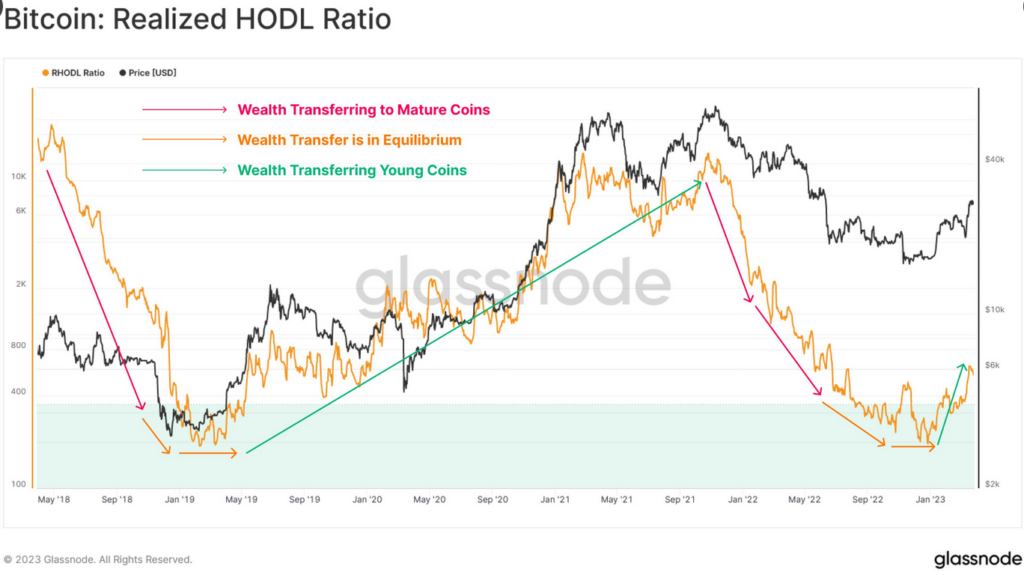
Source: Glassnode
A different take on the same data is the ratio of bitcoin in profit/loss. In the current cycle the loss ratio reached ~ 50% and stayed there for a reasonable period. The 50% level is marked by the blue line that we have drawn.
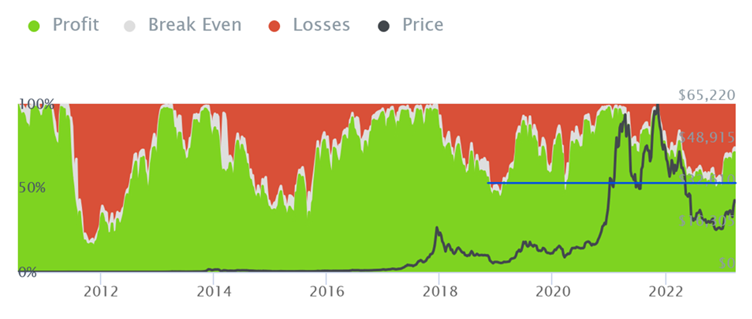
Source: Into the block
Also worth noting that the loss ratio shows an upward trend (smaller percentage of holders in loss) over time as a higher percentage of bitcoin is HODLed for longer periods. As a result, only investors purchasing in the most recent cycle will fall into loss.
Tokens held for longer than 1 years continue to rise at a steady pace
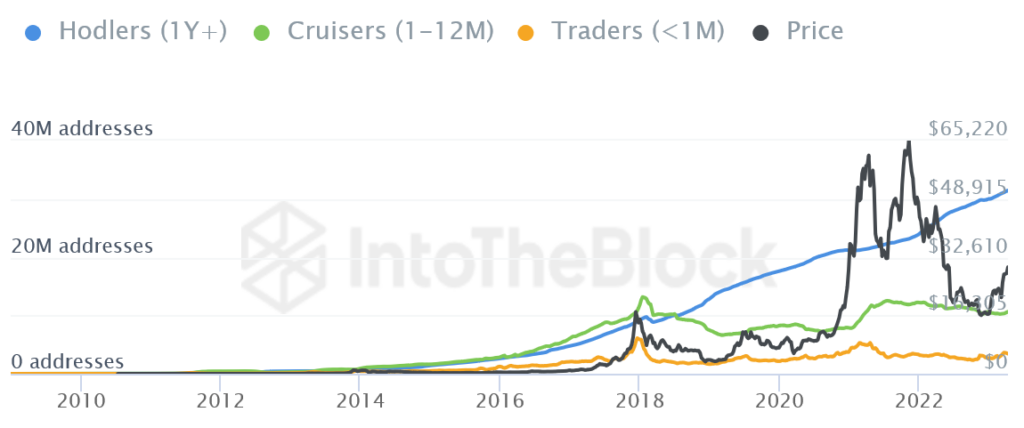
Source: Into the block
The chart above should provide confidence in the hardening of Bitcoin’s monetary property. Despite multiple ~80% price declines, bitcoin has experienced unwavering demand from more wallets.
Finally, the current bear market is tracking eerily similarly to the 2017 cycle.
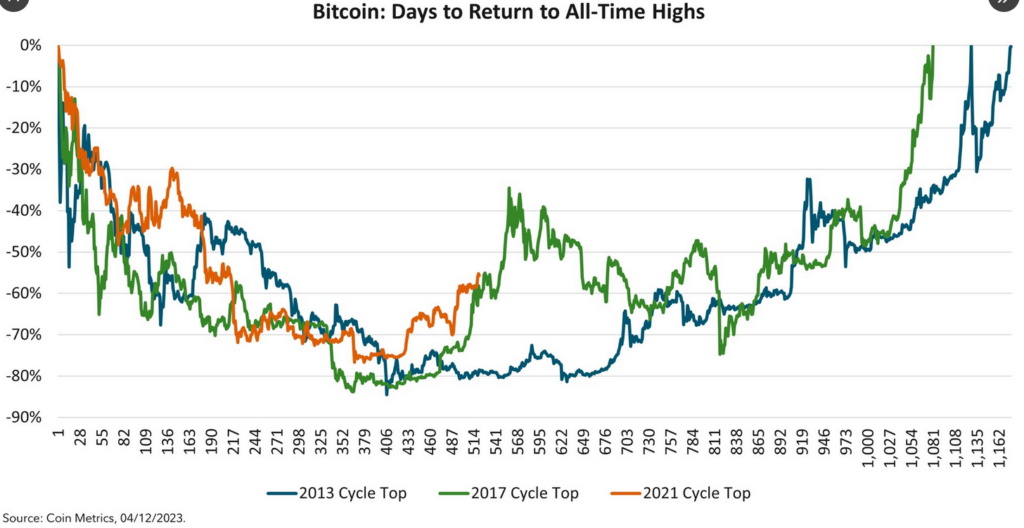
Source: Jack Neureuter @ Fidelity Digital
Is Bitcoin ready for a sustained rally to new highs?
The signals around the current rally aren’t robust. Bitcoin spot volume has fallen sharply during the current rally, which is often not a sign of a durable market.
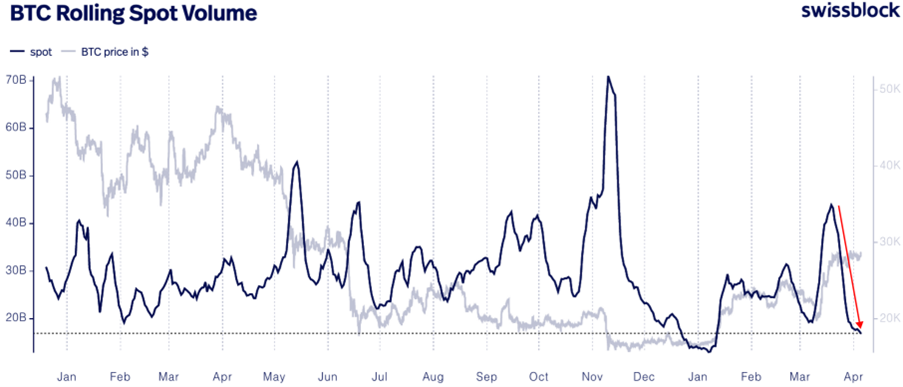
Source: Swissblock
Breadth since the breakout in March has also been poor with many of the smaller protocols not participating in this rally.
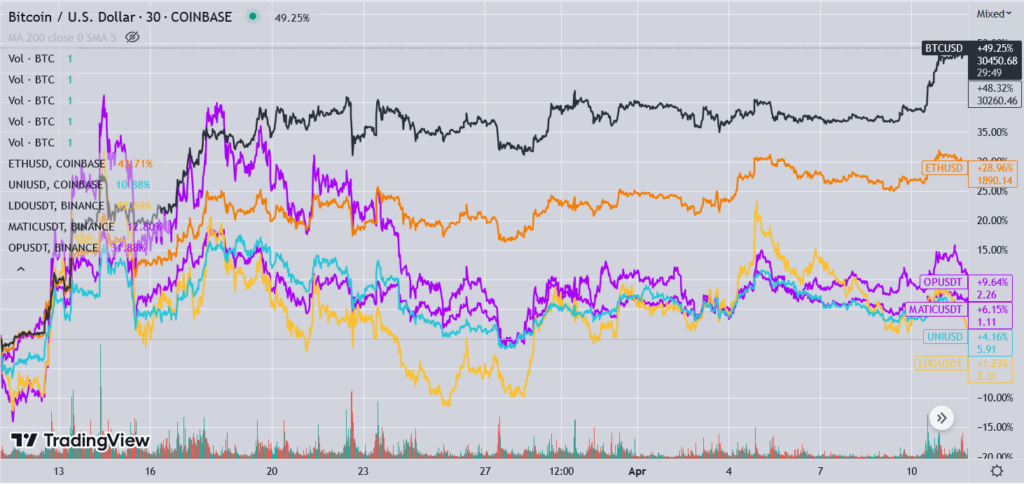
Source: TradingView
Positioning remains favorable, though, as futures open interest remains low.
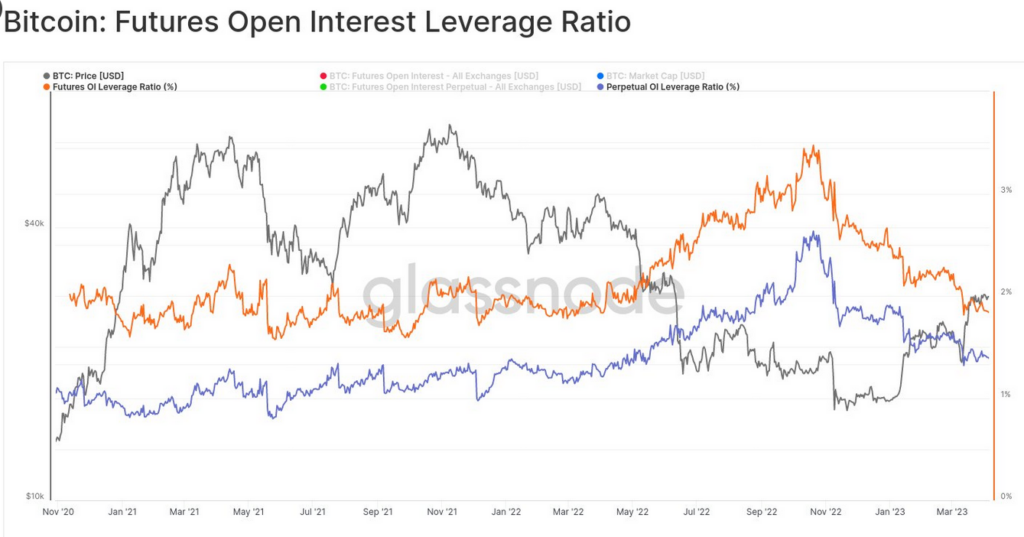
Source: Glassnode
Funding rates are also well contained. The funding rate is the annualized interest rate that investors have to pay to take a long position via perpetual futures.
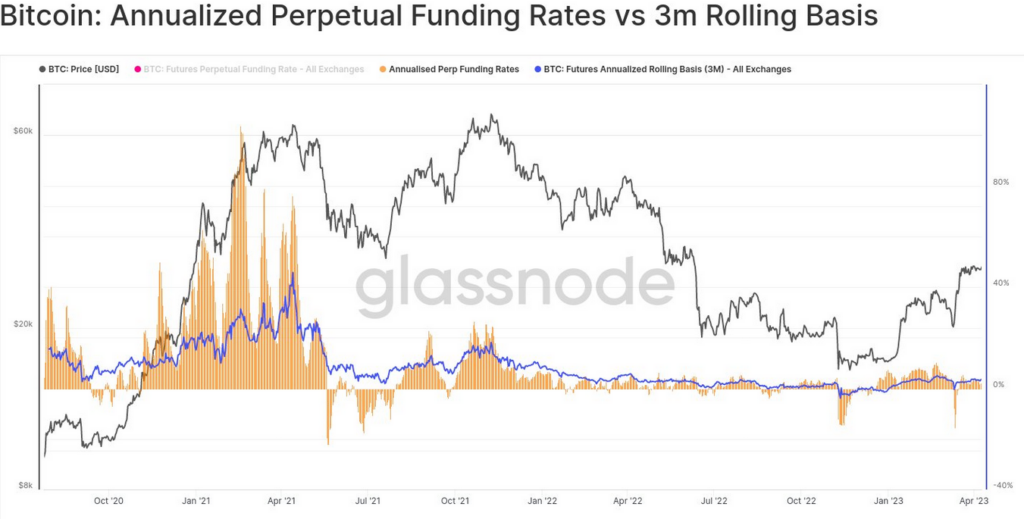
Source: Glassnode
Some of the upside exposure has shifted to the options market.
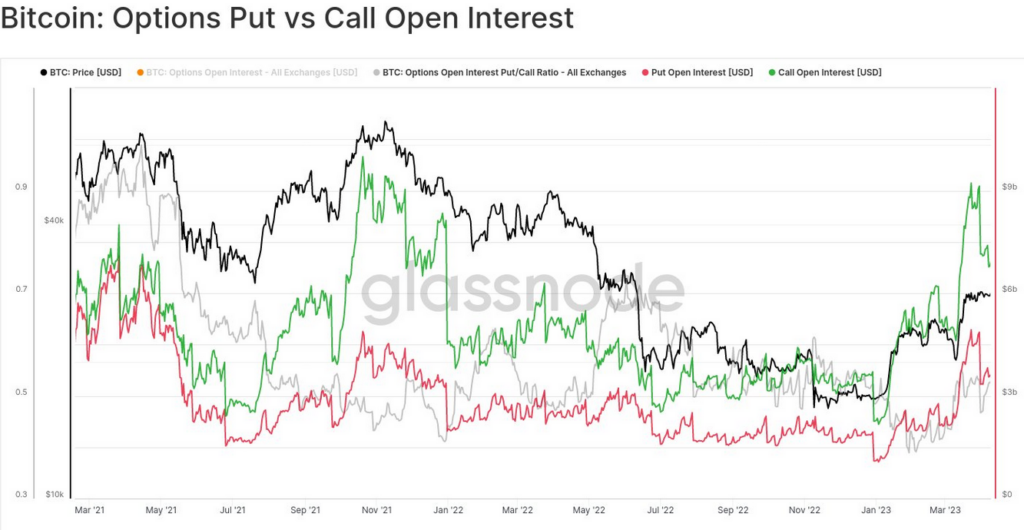
Source: Glassnode
Bitcoin has kept pace with some of the highest beta tech stocks. The narrative, though, is that bitcoin is up >70% in 1Q2023, whereas broader stock indices are up far less. In prior cycles, no large cap stocks kept up with bitcoin rallies. We anticipate similar performance once the Fed decides to inject liquidity, which will first require a sharp economic slowdown and worries about a deflationary outlook.
What caught our eye this week
This will likely become a recurring segment in each Dispatch as we find interesting data during our daily market-macro analysis. We are often looking to refute our existing views, but it’s been tough to find any bullish data other than the occasional positioning information. It’s not looking good out there despite continued market strength.
Bankruptcies are ticking higher in 2023. This is S&P data for large companies with public debt issuances.
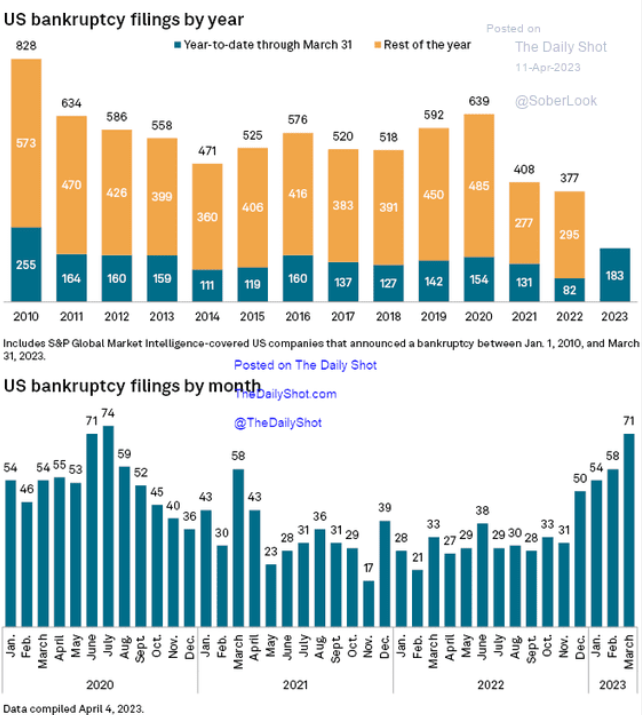
Source: S&P via The Daily Shot
Small business is experiencing a sharp contraction in credit availability following bank stress in March. This is based on survey data from the small business association (NFIB).
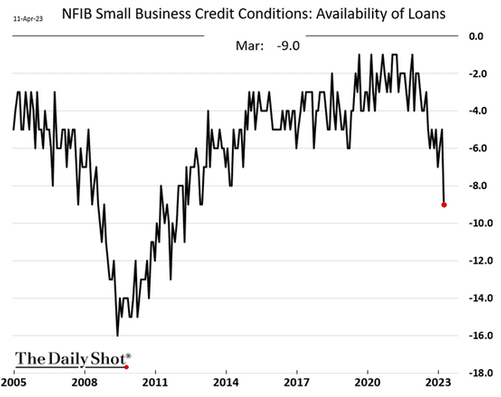
Source: NFIB data via The Daily Shot
Loan availability for small businesses, which employ nearly half of US workers, is correlated closely with unemployment claims. We see a high probability of the current divergence resolving with initial claims rising.
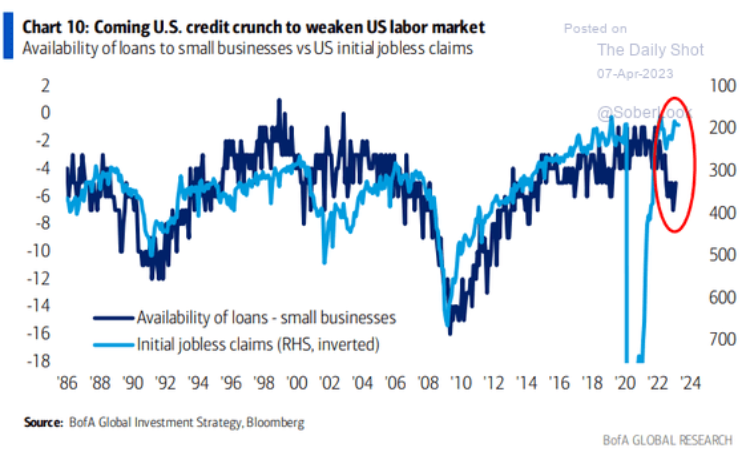
Source: BofA via The Daily Shot
Fed’s emergency lending to banks has trickled lower. We believe the risk of bank runs have been replaced by a bank slow leak of deposits, which may lead to some banks idiosyncratically tapping the Fed facilities in the coming months.
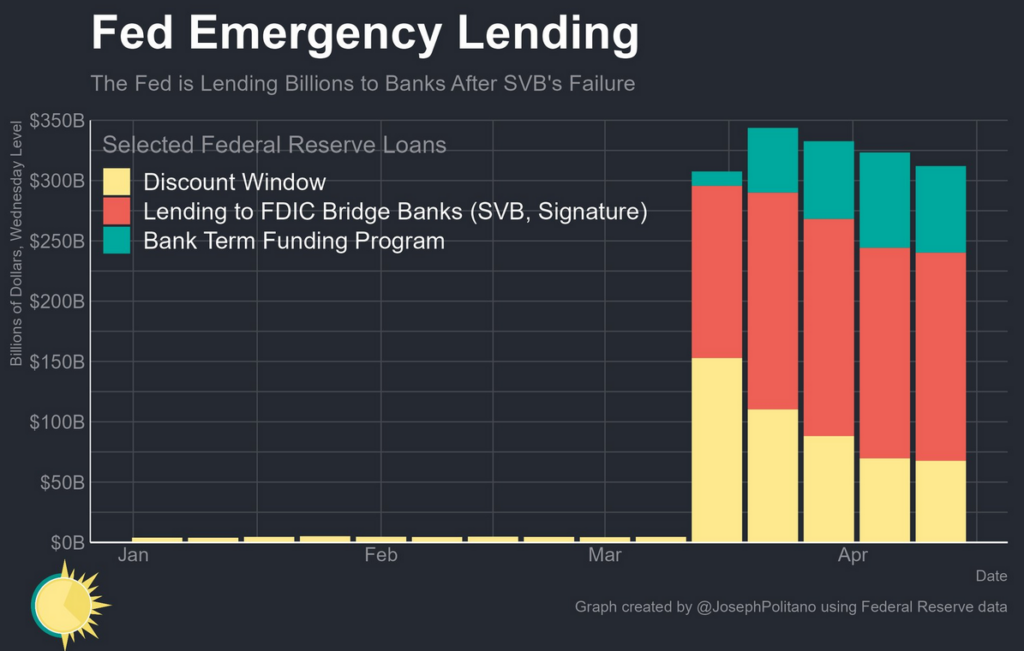
Source: Joey Politano
On the positive front, investors are short (already bearishly positioned) near record value of S&P 500 index futures.
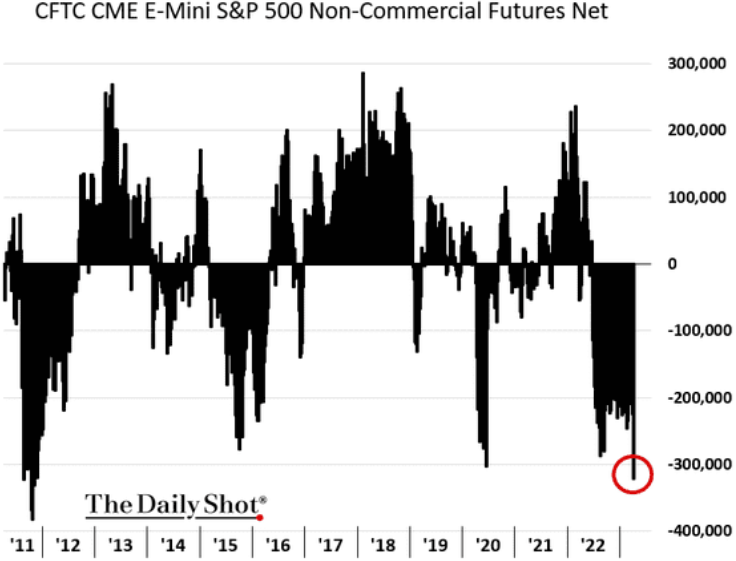
Source: The Daily Shot
However, the same is not true when looking at a broader set of stocks. Short exposure on the Russell 3000 ETFs and stocks is at multi year lows.
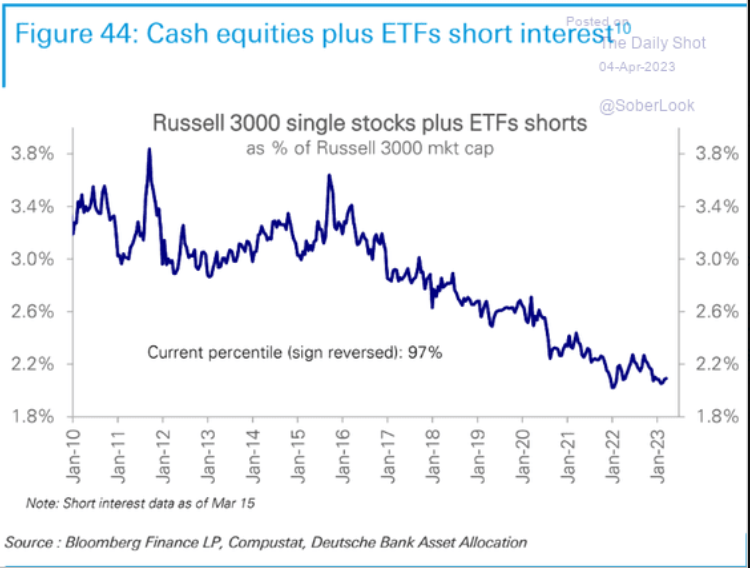
Source: Deutsche Bank via The Daily Shot
Thanks for reading all the way to the end.
Important Disclosures
| This is not an offer or solicitation for the purchase or sale of any security or asset. Nothing in this post should be considered investment advice. While the information presented herein is believed to be reliable, no representation or warranty is made concerning its accuracy. The views expressed are those of RockDen Advisors LLC and are subject to change at any time based on market and other conditions. Past performance may not be indicative of future results. At the time of publication, RockDen and/or its affiliates may hold positions in the instruments mentioned in this newsletter and may stand to realize gains in the event that the prices of the instruments change in the direction of RockDen’s positions. The newsletter expresses the opinions of RockDen. Unless otherwise indicated, RockDen has no business relationship with any instrument mentioned in the newsletter. Following publication, RockDen may transact in any instrument, and may be long, short or neutral at any time. RockDen has obtained all information contained herein from sources believed to be accurate and reliable. RockDen makes no representation, express or implied, as to the accuracy, timeliness or completeness of any such information or with regard to the results to be obtained from its use. All expressions of opinion are subject to change without notice, and RockDen does not undertake to update or supplement its newsletter or any of the information contained therein. |